When is the Best Time to Buy?
In any investment, one of the biggest concerns is the right timing for purchasing stocks of interest. Today, let’s explore the timing strategies for buying and selling using Granville's rules.

Granville's Buying Strategies
In Granville’s theory, the moving average line used as a benchmark differs depending on the investment period:
- For short-term investments, use the 20-day moving average.
- For long-term investments, use the 200-day moving average.
Buying Strategy 1: Buy when the price has been forming waves below the moving average but then breaks through it.
If the candlestick closes above the 20-day moving average, it suggests that those who purchased within the last 20 days are making a profit, which could be interpreted as a buying opportunity during the end of a downtrend or the start of an uptrend.
Buying Strategy 2: Buy when the moving average is rising, but the stock price dips.
A tendency exists for the candlestick and moving average to attract each other. If the candlestick falls below the moving average but there is a large gap, this increases the probability of a price rebound.
Buying Strategy 3: Buy when the candlestick is dropping but does not fall below the moving average, instead rising alongside it.
The moving average itself serves as a strong support level or resistance for the candlestick.
Buying Strategy 4: Buy when the candlestick is below the moving average but rises to meet it and follows it upward.
This strategy is often seen in the early stages of an uptrend.
When Should You Sell?
The saying goes that buying is a skill, but selling is an art. For new investors, deciding when to sell is often more challenging than deciding when to buy.
In my honest opinion, when you make an investment decision, it’s best to have a selling strategy in place as well. However, as the market can change quickly, many investors are often torn between selling and holding on, wondering, "Will it go up more?" or "What if it falls further?"
To help with these decisions, here are four selling strategies based on Granville's 8 rules.
Granville’s Selling Strategies

Selling Strategy 1: Sell if the moving average has been rising but then flattens, and the candlestick breaks below it.
If the candlestick drops below the 20-day moving average, it implies that those who bought within the last 20 days are now incurring losses, which could trigger a strong selling trend due to stop-losses.
Selling Strategy 2: Sell when the moving average has been falling, and the candlestick briefly rises above it.
If the candlestick is below the moving average, it means that existing investors are at a loss. Many investors who have missed a stop-loss or are waiting may sell once the candlestick rises momentarily above the moving average.
Selling Strategy 3: Sell if the candlestick approaches the moving average but fails to break above it and then starts to decline again.
This could signal a strong wave of disappointment-driven selling.
Selling Strategy 4: Sell when the candlestick has surged, creating a large gap between it and the moving average.
There’s a strong pull between the candlestick and the moving average. If the gap has widened due to a surge, it can lead to a pullback as investors realize profits.
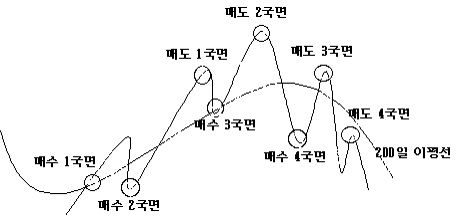
Chart Technical Analysis/Technical Analysis Elliot Wave Theory] Basic Impulse Wave of Elliot Wave
The Elliott Wave Theory is a popular technical analysis tool used to predict the future behavior of financial markets by identifying recurring wave patterns. Here’s an overview of its main concept, focusing on the basic impulse wave. Impulse Wave The i
luckyday4u.tistory.com
Chart Technical Analysis/Technical AnalysisElliot Wave Theory] Ending Diagonal, Reading Diagonal, Extended Diagonal
In Elliott Wave Theory, diagonal patterns are specialized wave structures that often form in the impulse or correction phase. They come in a few varieties, each with distinct rules and characteristics. Here's a breakdown:1. Leading Diagonal (Reading Diagon
luckyday4u.tistory.com
Elliott Wave Theory ] Complex Corrections [Double Combo,Triple Combo Pattern, WXY -3wave, WXYXZ-5wave]
Double Combo PatternStructure: W-X-Y (3 waves)Appearance Locations:In an impulse wave, during the 2nd or 4th waveIn a zigzag correction, as the B waveAs the A wave in a flat correctionWave Composition:W Wave: Zigzag, double zigzag, triple zigzag, or flatX
luckyday4u.tistory.com

댓글