1. Moving Average #1 What's the moving average?
A moving average (MA) represents the average closing price of a stock over a set period, such as 5, 20, or 120 days. It reflects the market's recent sentiment:
- 5-Day MA: Tracks a week of prices, indicating ultra-short-term trends.
- 20-Day MA: Reflects a month’s average price.
- 60-Day MA: A three-month average.
- 120-Day MA: A six-month average.
- EX] 5-day moving average = Ultra short line reflecting stock price average over last 5 days
- sentiment Equation = 5MA = the day + 1 + 2 + 3 + 4 / 5, the day included closing average for the last 5 days
- EX 2] 20-day moving average = stock price average for the last 20 days, including the day, closing average for the last 20 days.
Except for holidays
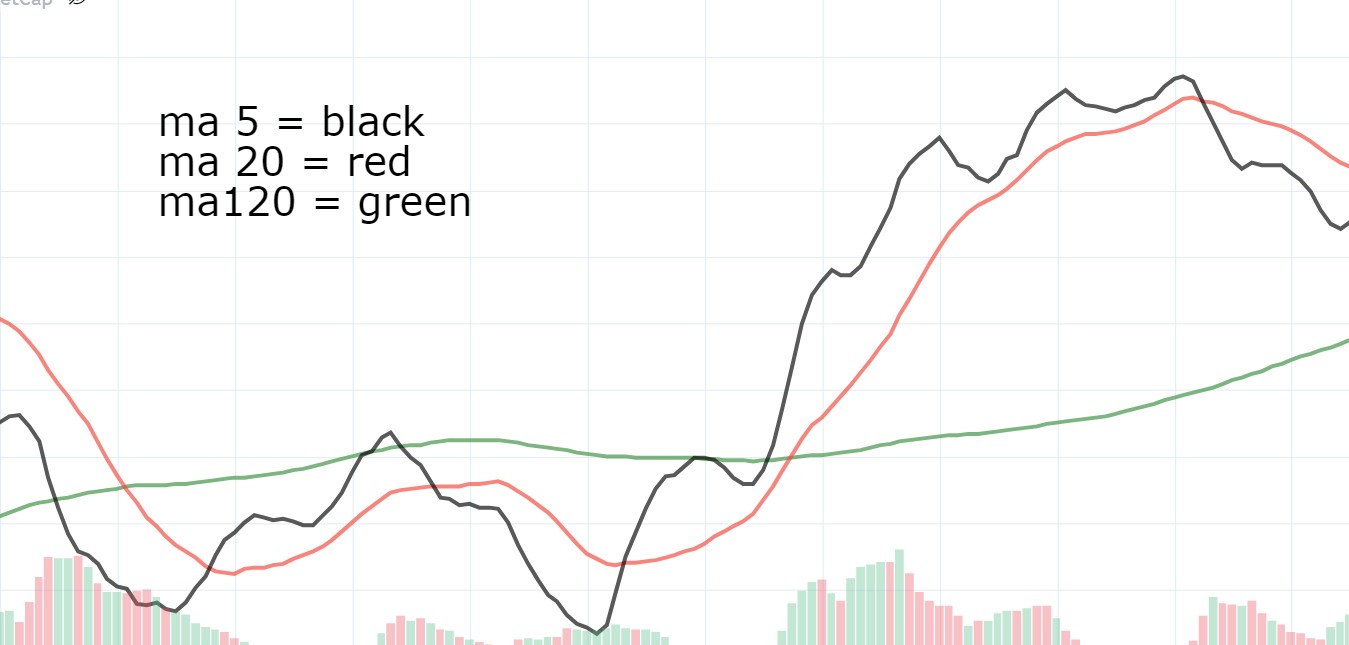
Rising MA: Signals a bullish trend, where most recent buyers profit, supporting further buying.
Rise of the moving average Rise of MA = bullish phase Rise of MA = Rise of the buying average = Participants' sentiment is stable As in the chart above, when the candle moves above 20MA, it means that the majority of the buying in the last month are taking advantage. Therefore, we can expect a continuous inflow of buying.
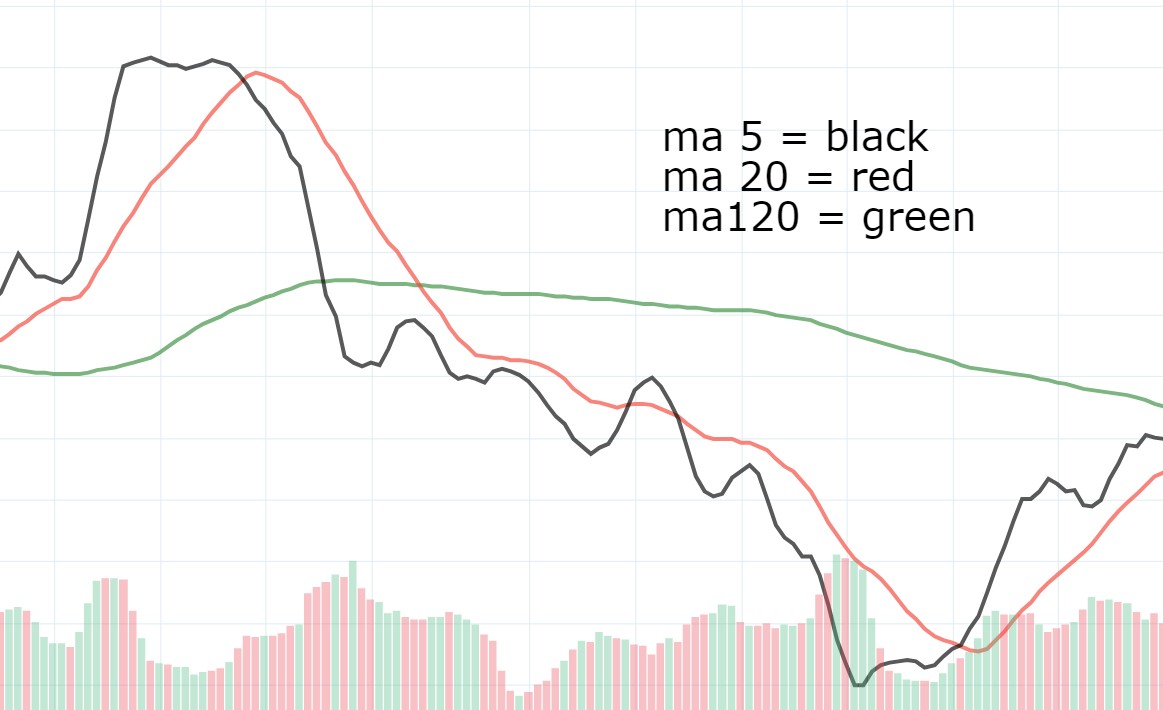
Falling MA: Signals a bearish trend, where recent buyers face losses, which may prompt selling.
a decline in the moving average This flat falls = bearish phase A fall in the equilibrium = a fall in the average purchase value = Participants' psychology is unstable. Like the chart above, if the candle is below the horizon on the 20MA, it means that most of the buying participants have been losing money in the past month. When the price bounces, it's likely to sell on the main note
*Trading must be different depending on whether this horizon rises or falls
EX] Adjusts when the eclipses rise = Adjusts when the eclipses fall = Sell
*Of course, this is a probability problem and it's not always right, but you have to bet on the side with a higher probability of even 1%.
The stock price goes up and down repeatedly.
Beginners need to make a bet when this horizon turns from circular to upside to make a profit.
The standard is more than 120.


Trends & Trading Strategy
In an uptrend (e.g., price > 5MA > 20MA > 120MA), buying is favored. Conversely, in a downtrend (e.g., 120MA > 20MA > 5MA > price), selling is likely. Trading involves betting on setups with the highest probability.

댓글