Understanding the BB% b Indicator in Bollinger Bands
The BB% b indicator is a tool for analyzing how high the current price is within a specific N-day period, based on Bollinger Band data. Its functionality is similar to the Stochastic indicator but applied to the bandwidth of Bollinger Bands rather than price movements.
BB% b Indicator Formula
BB% b is calculated as:
BB% b = (Current Price - Bottom Band) / (Top Band - Bottom Band)
This equation shows the relative position of the current price within the Bollinger Band range.
Using the BB% b Indicator in Bollinger Bands
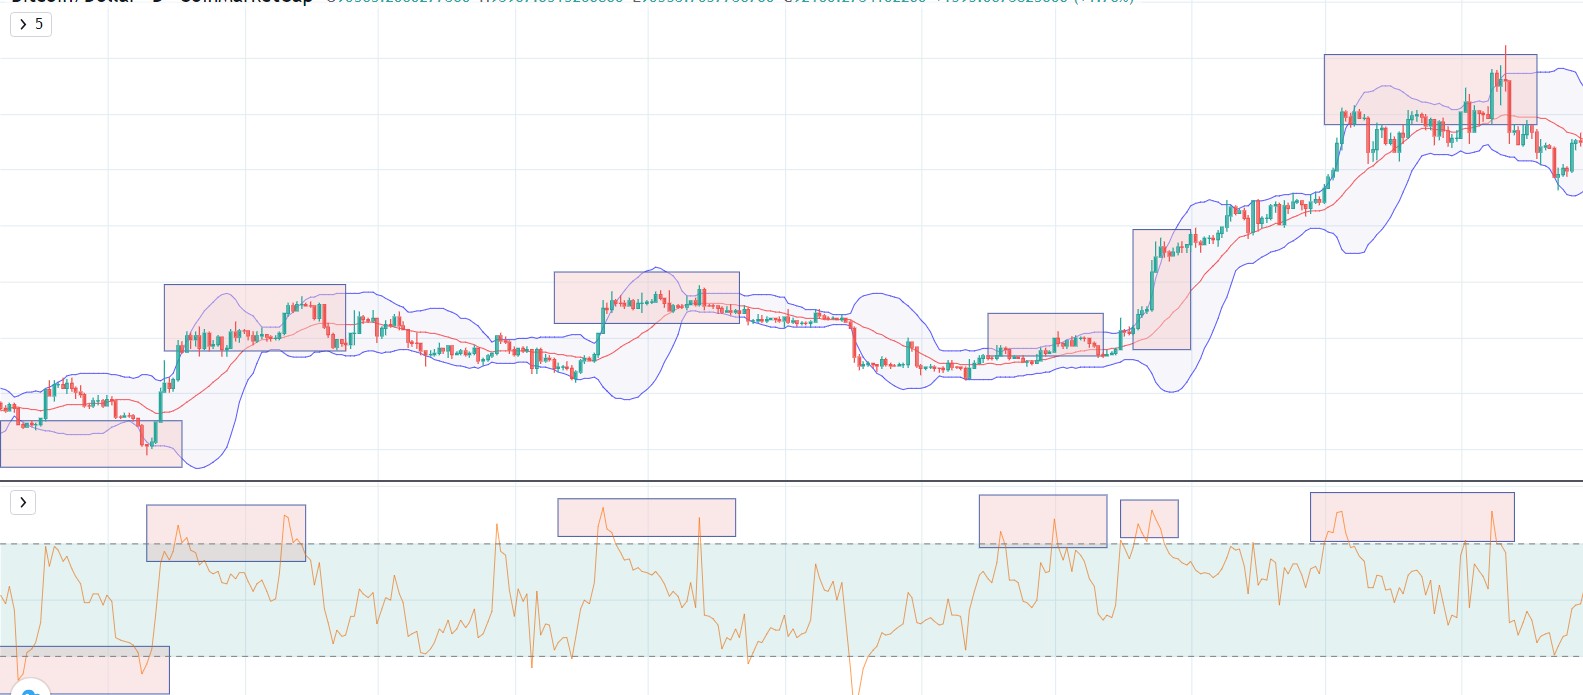
1. Overheating Zones
The BB% b indicator enters the overheating zone when the candle crosses the top or bottom line of the Bollinger Band.
- Key Question:
Does an overheated BB% b signal strength, or is it a sell/buy signal? - Answer:
The BB% b indicator alone is insufficient to make reliable predictions. This is why it is typically used alongside other indicators like BBW (Band Width) and the Bollinger Band itself.
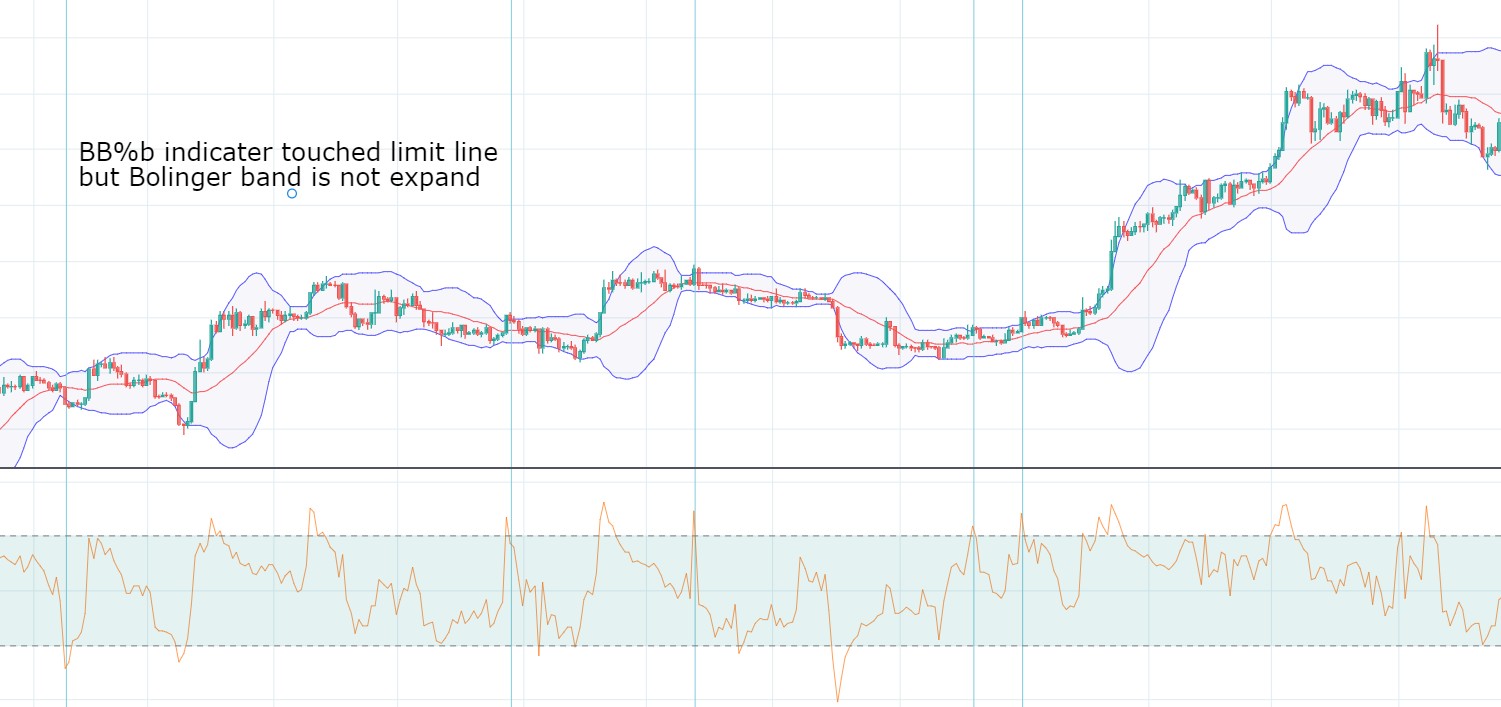
2. Interaction with Bollinger Band Expansion or Convergence
The movement of candles in the overheating zone can vary significantly depending on whether the Bollinger Band is expanding or converging. When the BB% b indicator enters this zone:
- Expanding Band: Indicates potential continuation of the trend.
- Converging Band: Signals that the trend may reverse soon.
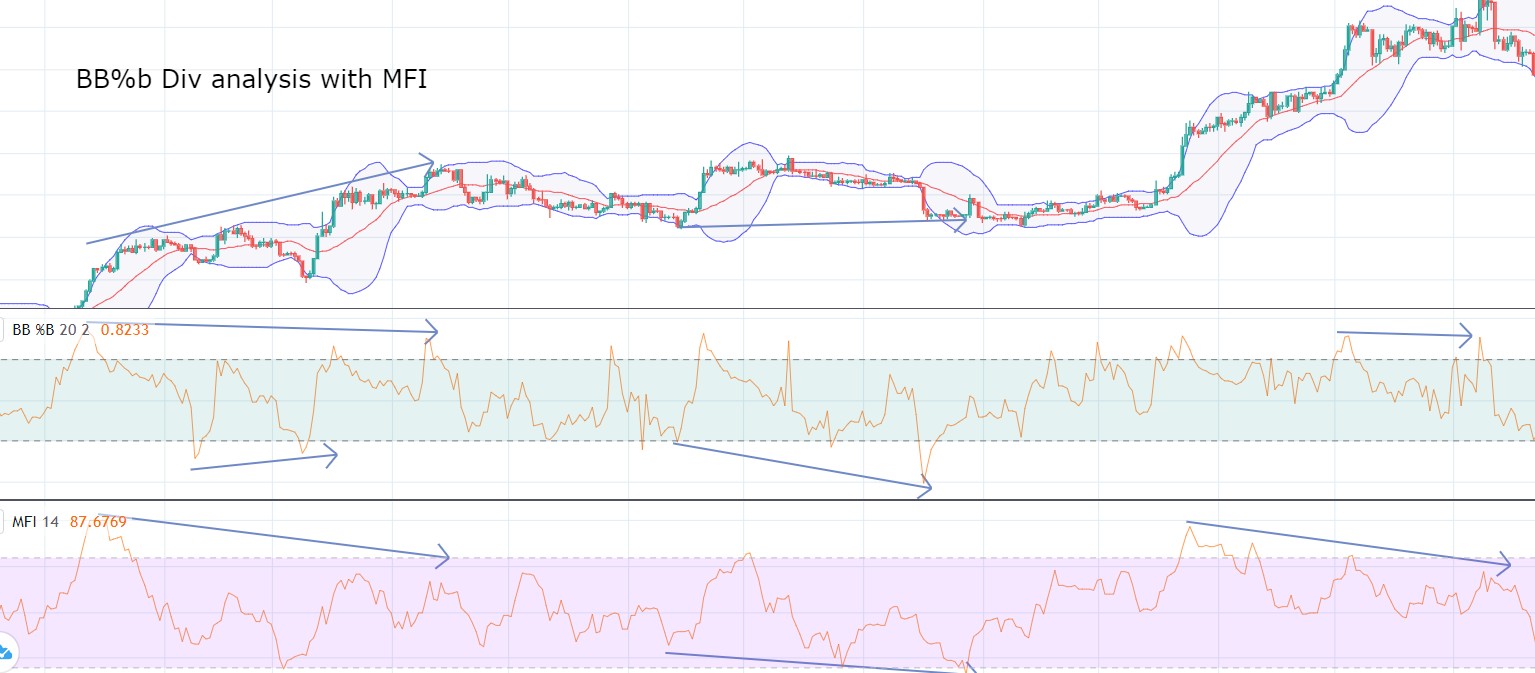
Divergence Analysis with the BB% b and MFI Index
By cross-analyzing the BB% b indicator with the Money Flow Index (MFI), you can identify reliable high and low points in price movements.
Key Patterns:
- High Points:
- When a rising candle touches the top of the Bollinger Band.
- Divergence is observed between the BB% b and MFI indices.
- The Bollinger Band converges rather than expanding.
- Low Points:
- When a falling candle touches the bottom of the Bollinger Band.
- Divergence is observed between the BB% b and MFI indices.
- The Bollinger Band converges rather than expanding.
Focus on M and W Patterns:
Analyzing M-shaped (high points) and W-shaped (low points) patterns in conjunction with the BB% b indicator, MFI index, and BBW can significantly enhance reliability.
Summary
The BB% b indicator is a valuable component in Bollinger Band analysis, especially when used with complementary indicators like BBW and MFI. While it highlights price positioning within the band, its predictive power increases when paired with analysis of band expansion, convergence, and divergence patterns.
Focusing on M and W patterns while cross-referencing other indices ensures greater confidence in identifying potential trend reversals or continuations.

댓글